By Binu Nadarajan, Practice Head for Cloud Services
Background
Over the past decade, software development using agile methodologies has brought about many changes in organizational processes. It resulted in a rethink of software architecture that allows for faster delivery of new features to customers, without impacting the whole application. In addition, DevOps tools and techniques enable organizations to increase collaboration between teams and automate the building, testing, and deployment of these services.
Microservices-based architecture has come as a boon for organizations who wish to achieve quick delivery cycles. In this architecture, an application is broken into multiple independently deployable services and run as containers. Many container orchestrators are available to deploy and manage containers – and Kubernetes, which was initially designed by Google and is now maintained by the Cloud Native Computing Foundation, is by far the most popular open-source orchestrator today.
Self-managed Kubernetes is the oft preferred approach to deploy and maintain containers to circumvent concerns about vendor lock-in. Typically, a cluster consists of many nodes and each node runs hundreds of containers. Hence, after the deployment of such a large number of containers, there is also the need to monitor their health, the communications between them, and the operations inside those containers. Traditional monitoring tools and processes are not adequate to monitor Kubernetes clusters and do not provide sufficient visibility since container environments have the following characteristics:
- They are built on a large distributed system
- They have a multi-layered architecture and hence we need to track numerous metrics
- They have a dynamic environment due to self-healing and auto-scaling capabilities
- Communications occur through virtual interfaces within and across nodes
This blog covers an overview of open-source tools that could be used to effectively monitor a self-managed Kubernetes cluster.
Key Performance Metrics
Host/Node – examples of these metrics are resources utilization at every node like network bandwidth, disk, CPU, and memory. Using these metrics, one can determine whether or not to increase or decrease the number and size of nodes in the cluster.
Pod – examples of these metrics are utilization of resources (like CPU, memory, file system, etc.) and the state of each pod. The number of pods running shows if the number of nodes available is sufficient and if they will handle the entire workload if a node fails.
Docker Container – examples of these metrics relate to utilization of resources (like CPU, memory, network bandwidth, file system, etc.)and the state of each container. The containers’ performance reveals whether the resources allotted for the pod are sufficient, and it helps to decide the placement of containers in pods.
Object – examples of these metrics are namespaces, deployments, secrets, persistent volumes and claims, service accounts, secrets, network policies, daemon sets, etc., and the state of each Kubernetes object. They help in troubleshooting and to identify the longevity and stability of the cluster.

Prometheus Architecture Overview
As shown in the above diagram, a typical Kubernetes cluster monitoring system built using Prometheus would typically need the following components:
- Prometheus Server to scrape and store time-series data.
- Exporters, namely client libraries or tools to export metrics from third-party systems.
- Storage including persistent storage on a local, on-disk time-series database. It can also be integrated with remote storage via remote read/write APIs.
- Dashboards to access visualizations of a collected time-series data in a few different ways using Prometheus native dashboard (WebUI) or advanced tools like Grafana.
- Alertmanager to notify a human operator about an occurrence of a specific condition, i.e., a rule defined as PromQL query. The actual alert is issued via integrations with external alerting tools like Slack, PagerDuty, Teams, etc.
- Pushgateway to push all the collected data to the database for short-lived jobs used for achieving and cleaning metrics.
The following is a quick overview of the tools being used.
Open-source container monitoring tools
Prometheus
Prometheus consists of a central component named Prometheus Server. It helps to monitor nodes, which are called targets. It can be a single target or multiple targets monitored for different metrics like CPU usage, memory usage, etc. It stores all its data as a time series and every time series is uniquely identified by its metric name and optional key-value pairs. This data can be queried via the PromQL, functional query language and visualized with a built-in expression browser or consumed by external systems like Grafana via the HTTP API.
Prometheus also has an alert manager component to send alerts via e-mail, Slack, or other alerting tools. One can define rules which Prometheus server reads and fires alerts when defined condition gets triggered.
Metrics Server
Metrics Server collects resource metrics like CPU or memory consumption for containers or nodes from Kubelets and exposes them in the Kubernetes API server through Metrics API.
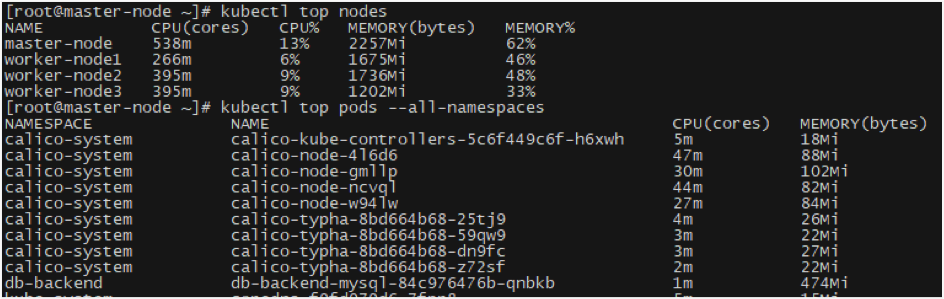
Sample Output of Top Command
Node Exporter
Node Exporter is deployed in every node as DaemonSet, and it collects and exposes a wide variety of hardware- and Linux OS-related metrics.
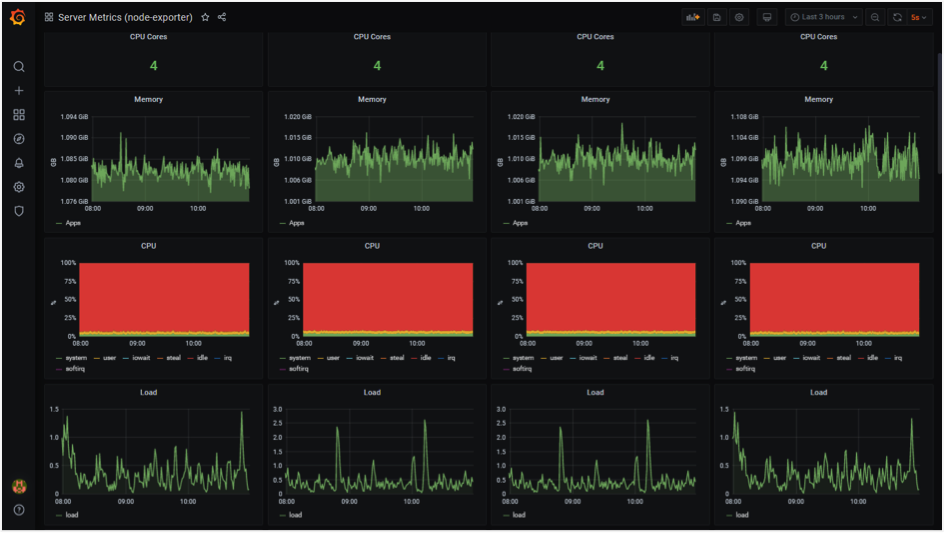
Sample Nodes’ Metrics Screen
Kube-state-metrics
Kube-state-metrics listens to the Kubernetes API server and exposes the state of Kubernetes objects such as config map, cron job, daemon set, deployment, endpoint, network policy, node, persistent volume, pod, service, etc.
Kube-state-metrics are different from resource utilization metrics of Kubernetes objects exposed by Metrics Server. Resource utilization metrics are directed towards the performance and health aspects such as network, memory, and CPU. In contrast, kube-state-metrics expose the count and state of objects, helping to get an overall visibility of what is going on within the Kubernetes cluster.
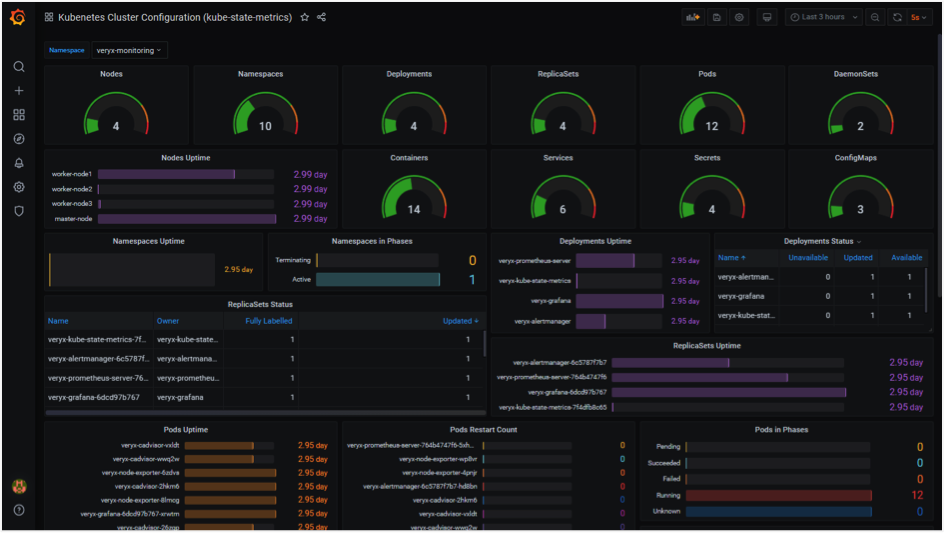
Sample Kubernetes Cluster Configuration Screen
cAdvisor
cAdvisor (Container Advisor) provides an understanding of their running containers’ resource usage and performance characteristics. It is a running daemon that collects, aggregates, processes, and exports information about running containers in each node. cAdvisor has native support for Docker containers. The Kubelet fetches data from the cAdvisor and exposes the aggregated pod resource usage statistics through the metrics-server Resource Metrics API.
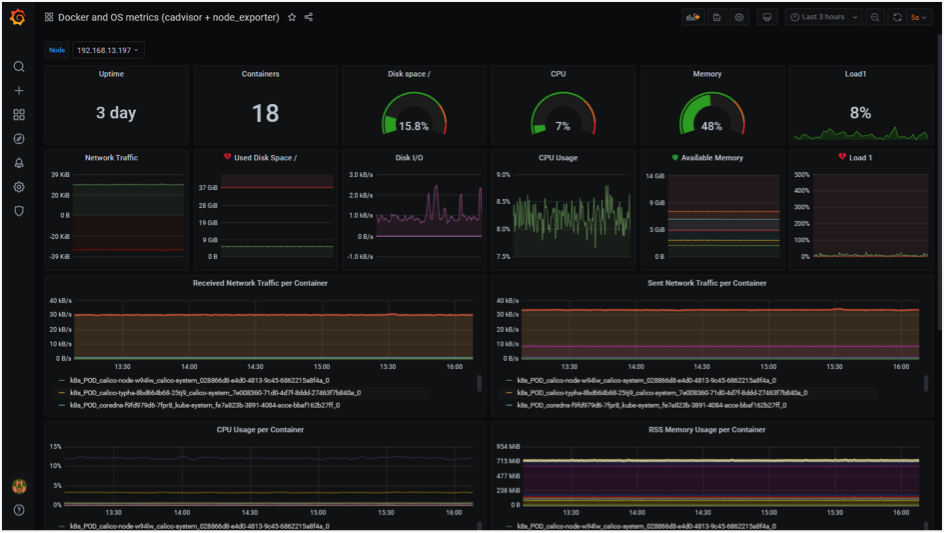
Sample Containers’ Metrics Screen
Alertmanager
Alertmanager is a single binary that handles alerts sent by Prometheus Server and notifies end-user through E-mail, Slack, or other tools. Alert rules are defined in Prometheus Server configuration. Prometheus server scrapes metrics from its client applications. If an alert condition hits, it sends alerts to the Alertmanager, which manages the alerts through its pipeline of grouping, inhibition, silencing, and sending out notifications.
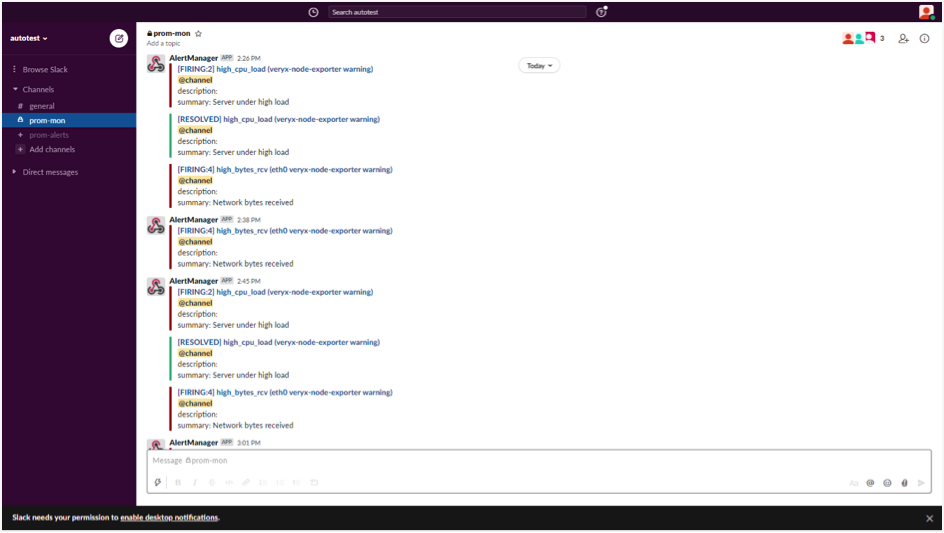
Sample Slack’s Screen
Pushgateway
Pushgateway is an intermediary service that allows pushing time series from temporary batch jobs to an intermediary job that Prometheus can scrape.
Kubernetes Dashboard
Kubernetes Dashboard is the official web-based UI for Kubernetes. The dashboard provides an overview of the Kubernetes cluster as well as the individual resources running in it. It has many features that allow users to create and manage workloads and do discovery, load balancing, configuration, storage, and monitoring.
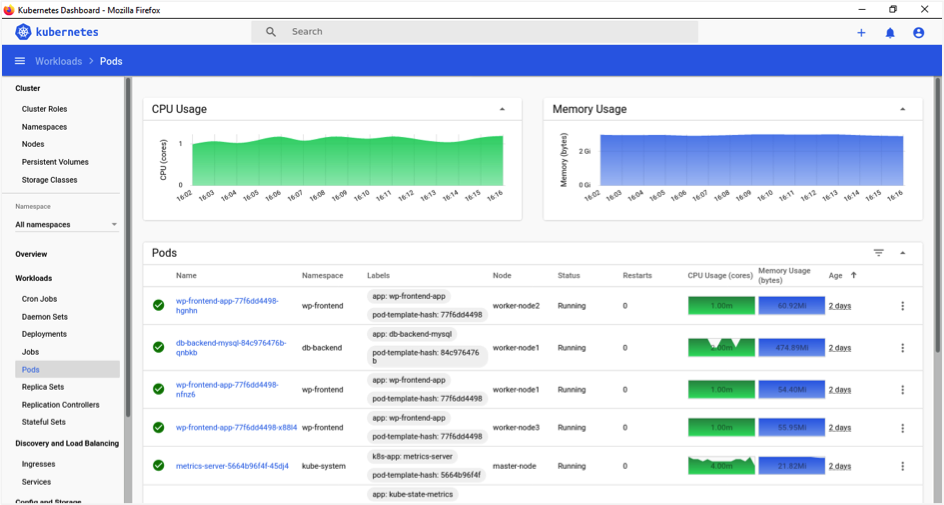
Sample Kubernetes Dashboard Screen
Grafana
Grafana is used to visualize time-series data. Prometheus acts as the storage backend and Grafana as the interface for analysis and visualization. After connecting Grafana with the Prometheus data source, it helps to create dashboards for the metrics to be monitored while also incorporating readily available dashboards from the official website.
Terraform
Terraform is a robust Infrastructure as a Code tool that follows a declarative programming model. The above-mentioned tools can be easily deployed with Terraform and maintained with its unique in-built features like source version control, remote backend, and workspaces. It is also integrated with CI/CD tools like Jenkins, Bamboo, and Gitlab for complete DevOps automation.
Conclusion
In this blog, I have provided a quick overview of tools used to set up a complete monitoring system for Kubernetes Clusters.
At Veryx Technologies, we help customers build their own container monitoring system quickly for their self-managed Kubernetes Cluster using open-source tools and deliver it as an Infrastructure as a Code solution using Terraform. To know more about our Microservices capabilities click here.
References
Prometheus full documentation, examples and guides – https://prometheus.io
Metrics Server – https://github.com/kubernetes-sigs/metrics-server
Node Exporter – https://github.com/prometheus/node_exporter
Kube-state-metrics – https://github.com/kubernetes/kube-state-metrics
cAdvisor – https://github.com/google/cadvisor
Alertmanager – https://prometheus.io/docs/alerting/latest/alertmanager
Pushgateway – https://github.com/prometheus/pushgateway
Kubernetes Dashboard (WebUI) – https://github.com/kubernetes/dashboard
Grafana – https://grafana.com/docs/grafana/latest/installation/docker
Infrastructure as Code – Terraform – https://www.terraform.io
About the Author: Binu Nadarajan

Binu Nadarajan is a networking industry veteran with 16 years of experience. Currently, he heads the cloud services practice at Veryx, helping businesses to successfully build infrastructure in the cloud as well as to migrate their applications to the cloud. In his spare time, Binu enjoys reading and playing with his little son.